Large-scale device load testing
Cloud Pile Connect provides a control plane + load agent architecture: deploy agents on your servers to simulate many YKC 1.6 or OCPP 1.6-J chargers on the LAN, then use the console to start/stop runs, monitor metrics, analyze timeseries, and generate load-test reports for capacity planning and protocol validation.
Protocol support
| Protocol | Simulated debugging | Simulated load test |
|---|---|---|
| YKC 1.6 | Yes | Yes |
| OCPP 1.6-J | Yes | Yes |
For single-device debugging, see Quick start. This page focuses on load testing.
Architecture
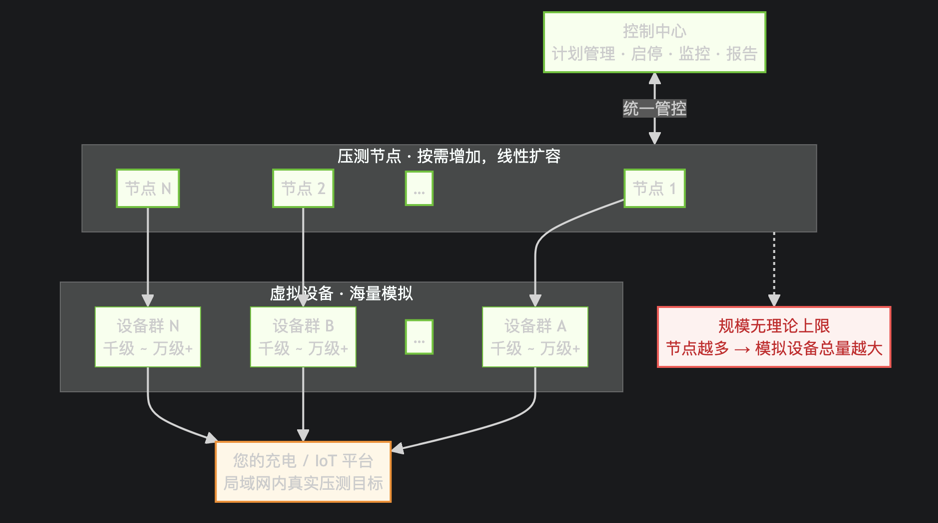
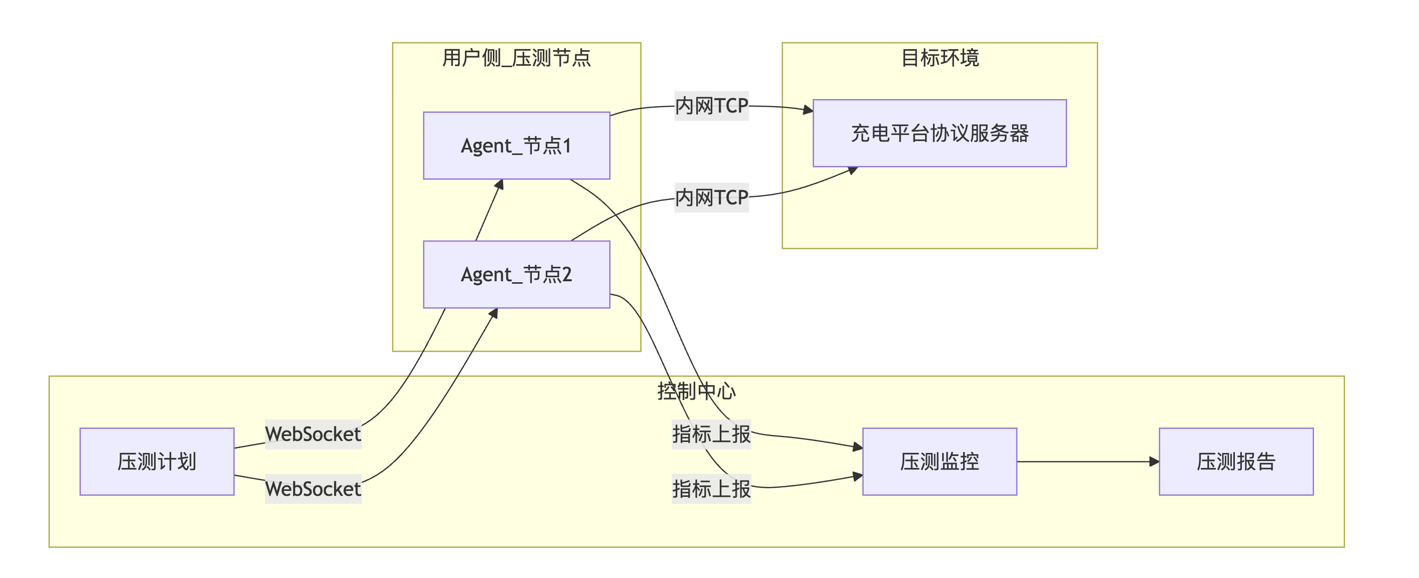
The platform is the control plane; load agents run on your servers or PCs. The control plane creates plans, sends start/stop commands, collects metrics, and generates reports. Agents talk to your protocol server on the LAN, avoiding public-bandwidth bottlenecks. Scale horizontally with multiple agents as needed.
Quick start (6 steps)
Step 1: Create a virtual device profile
Load-test plans bind to a virtual device profile (protocol behaviour, connector count, charging params). In the console: Virtual device → Virtual device config, add a profile with YKC1.6 or OCPP1.6-J.
Step 2: Create a load-test node
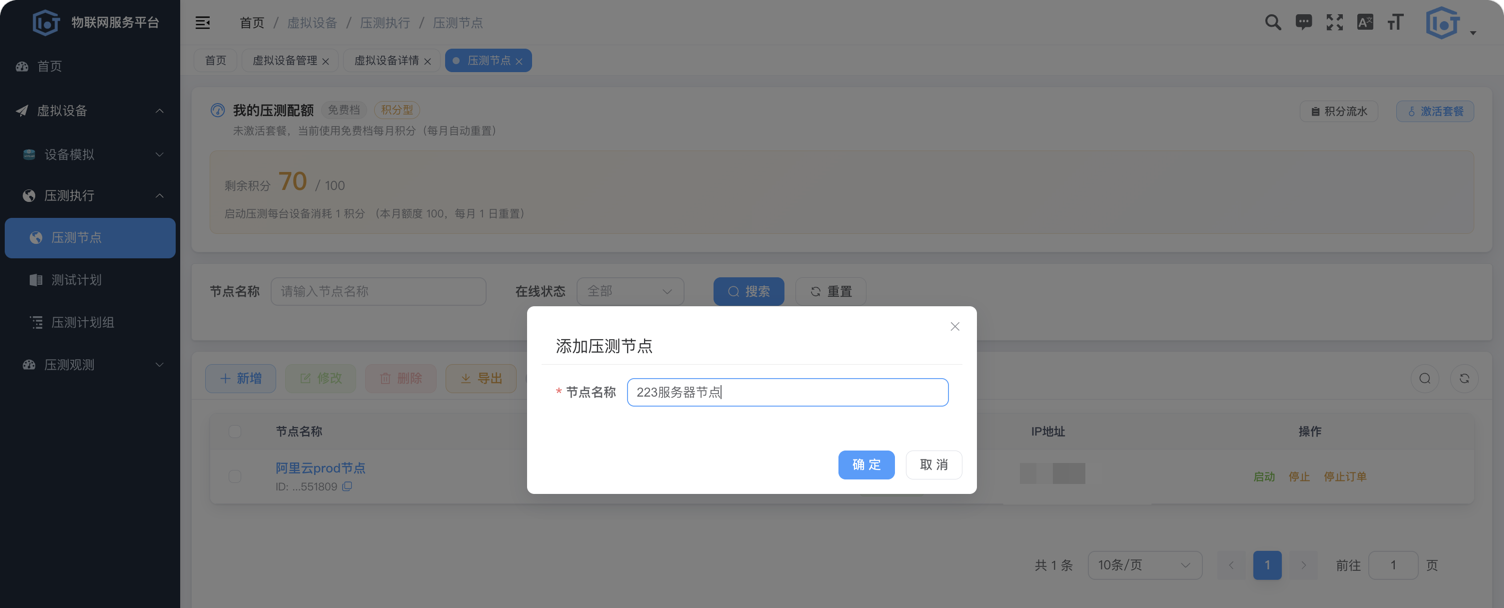
Open Virtual device → Stress nodes, click Add, enter a name, and save. The system assigns a node ID and token for agent authentication.
Step 3: Deploy the load agent
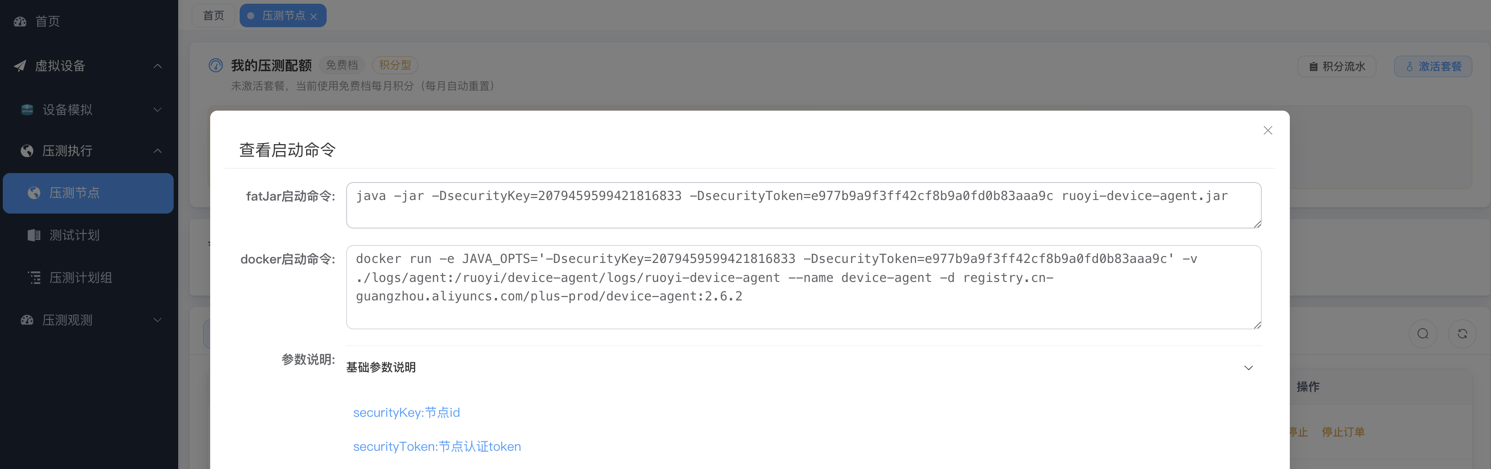
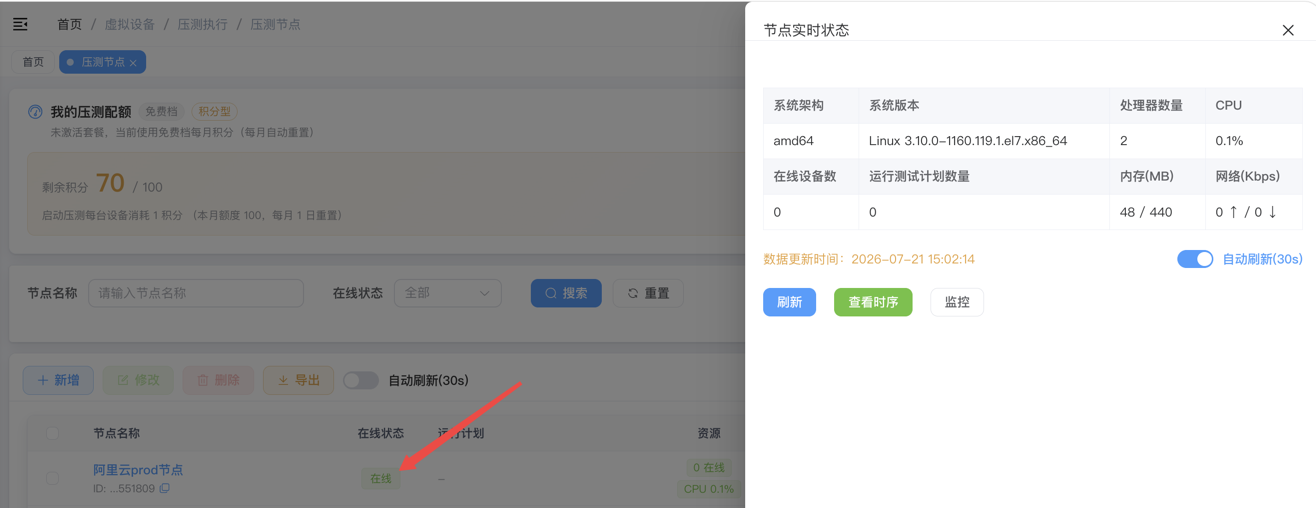
For offline nodes, click Command in the list to view startup commands. After deployment, Online status shows Online.
When online, click the node name to open real-time status (CPU, memory, online devices, etc.).
See Agent deployment below.
Step 4: Create a test plan
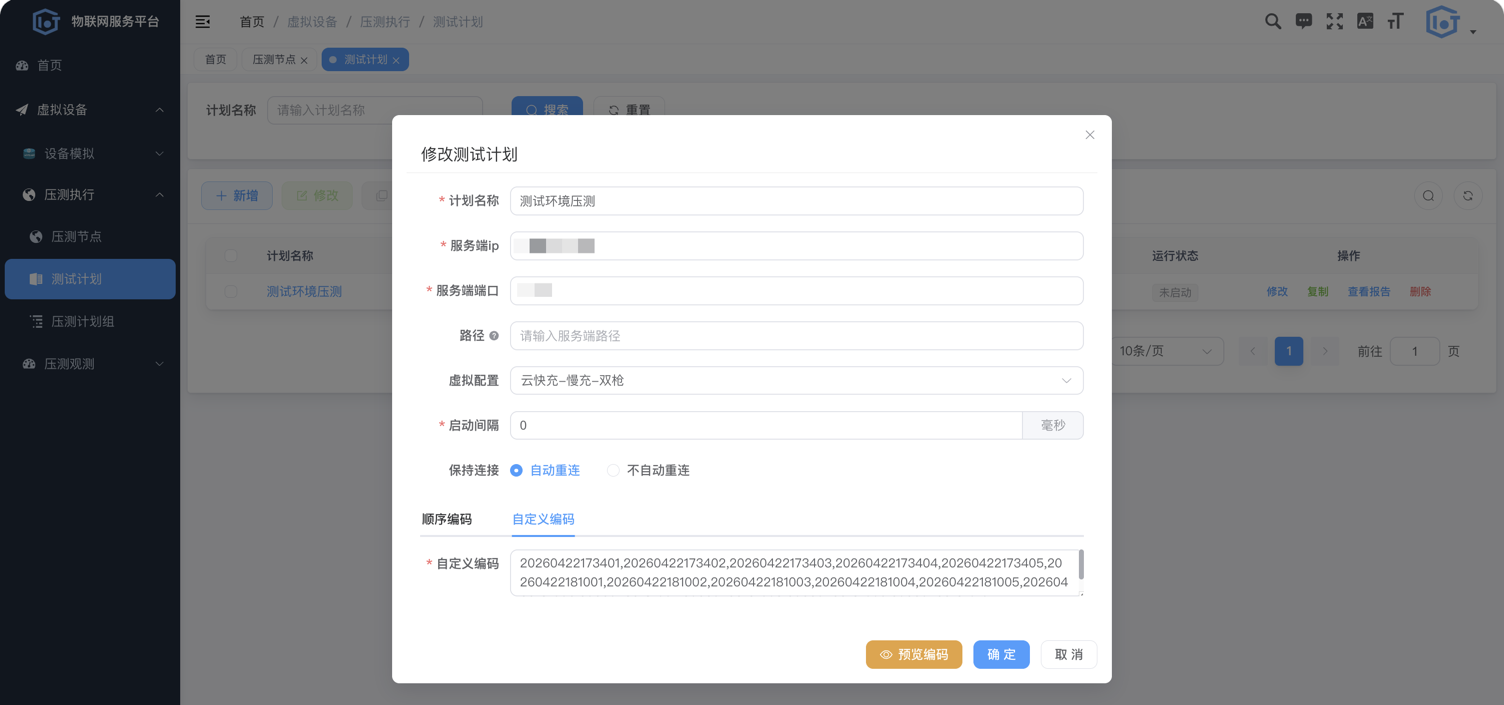
Open Virtual device → Test plans and configure:
| Field | Description |
|---|---|
| Server IP / port | Target charging platform protocol server |
| Virtual profile | Profile from Step 1 |
| Device count | Total simulated devices for this plan |
| Device codes | Sequential or custom encoding |
| Launch interval | Delay between each device coming online (ms) |
Step 5: Start the load test
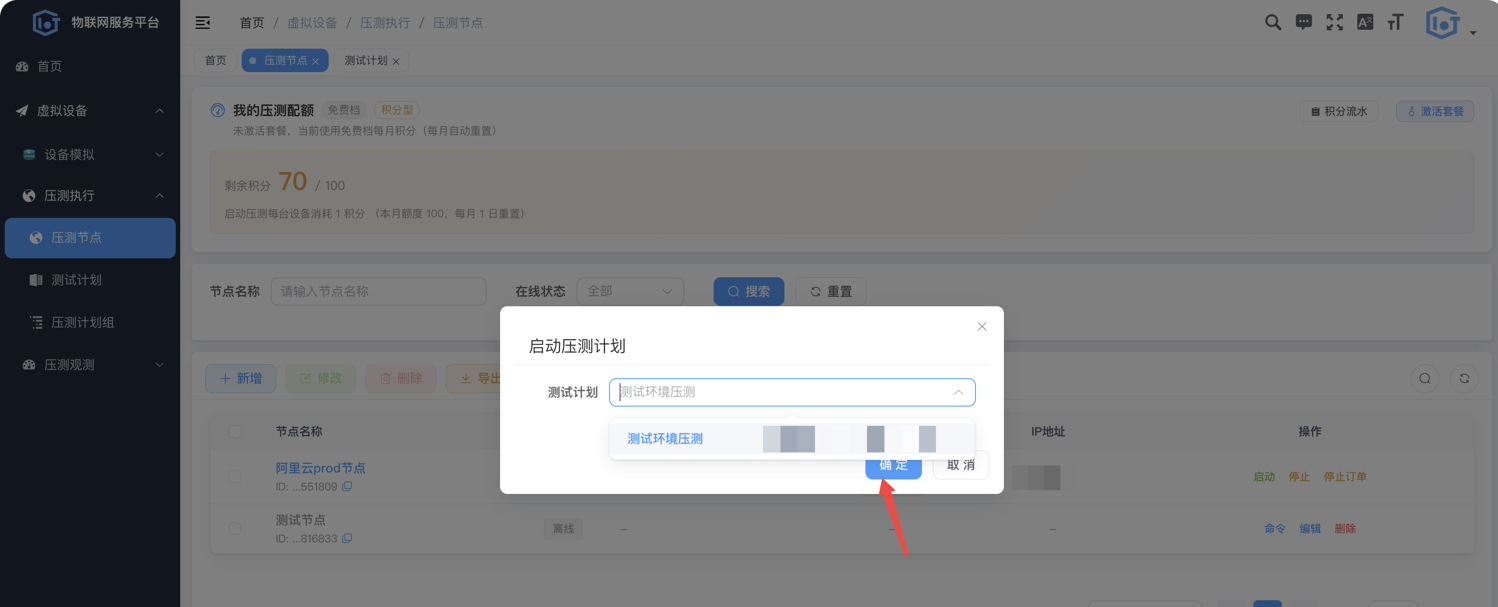
On the Stress nodes list, for an online node click Launch, select a plan, and confirm. The device quota banner at the top shows your account limit; launches are blocked if quota is exceeded.
Step 6: Monitor, stop, and report
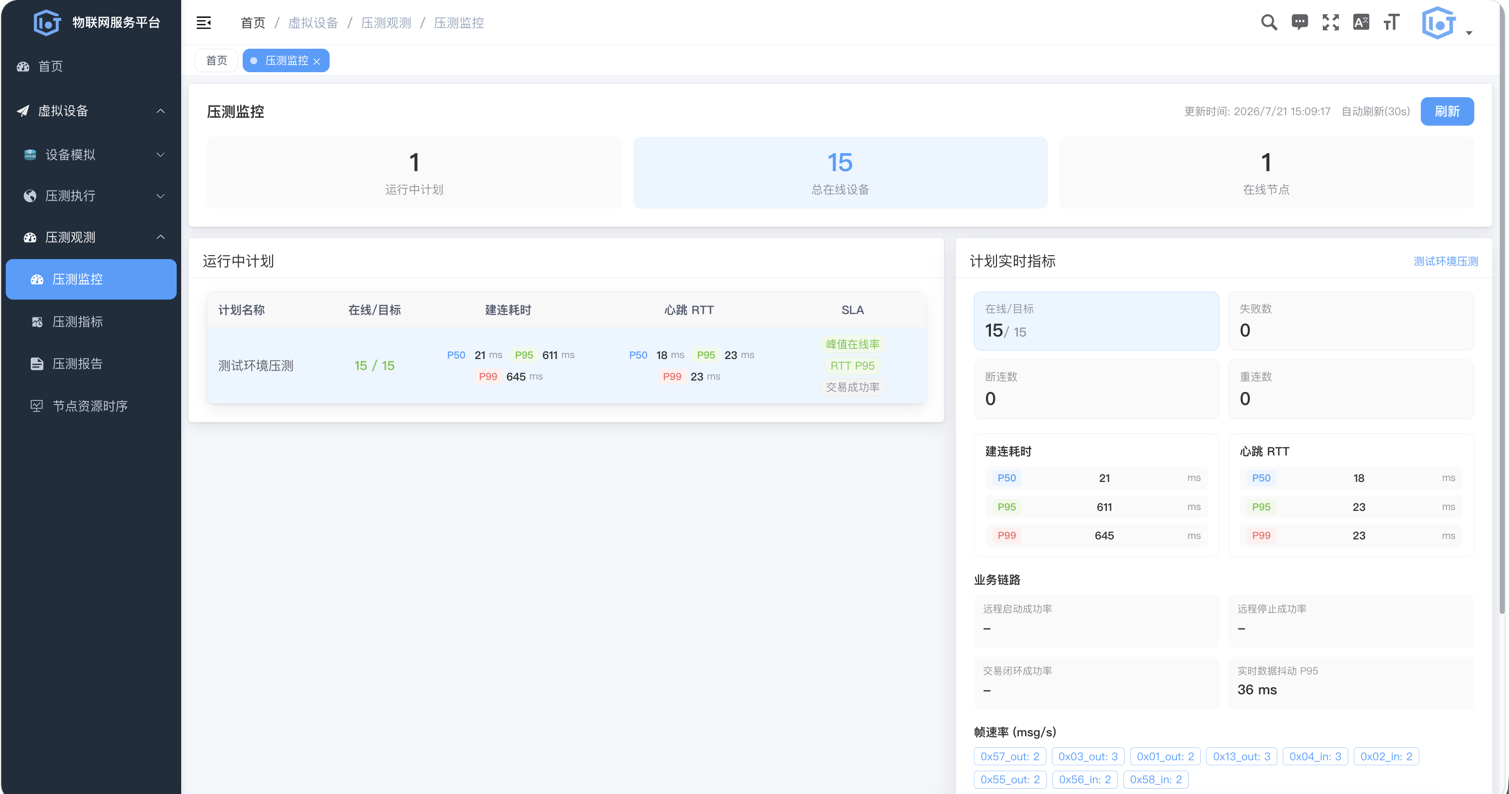
- Load monitor: All running plans — online/target, connect P95, heartbeat RTT, SLA indicators (30 s refresh)
- Stop: Click Stop on the node row and select running plans
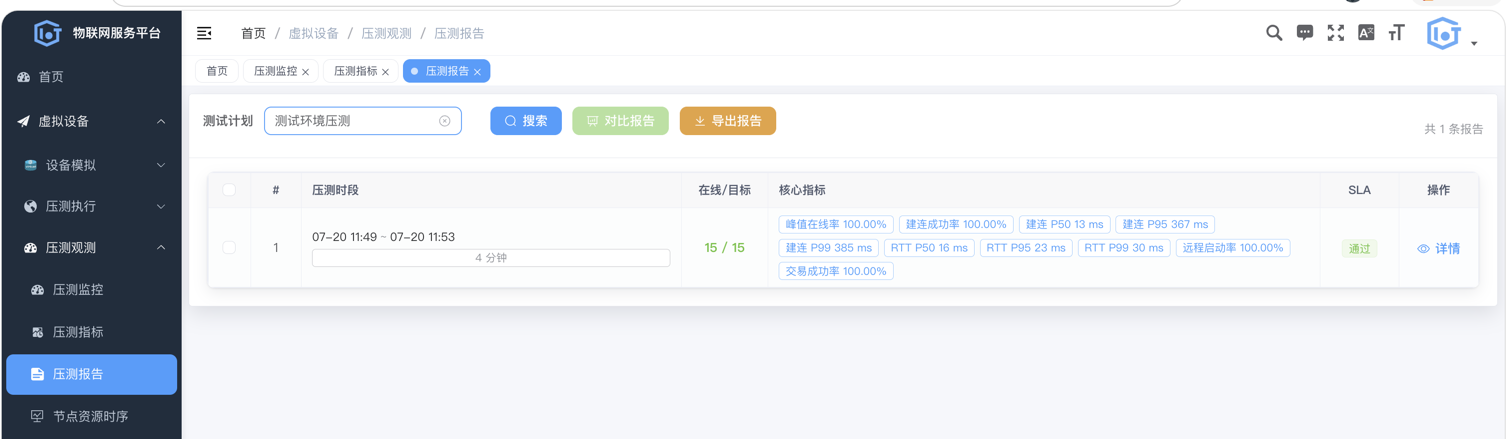
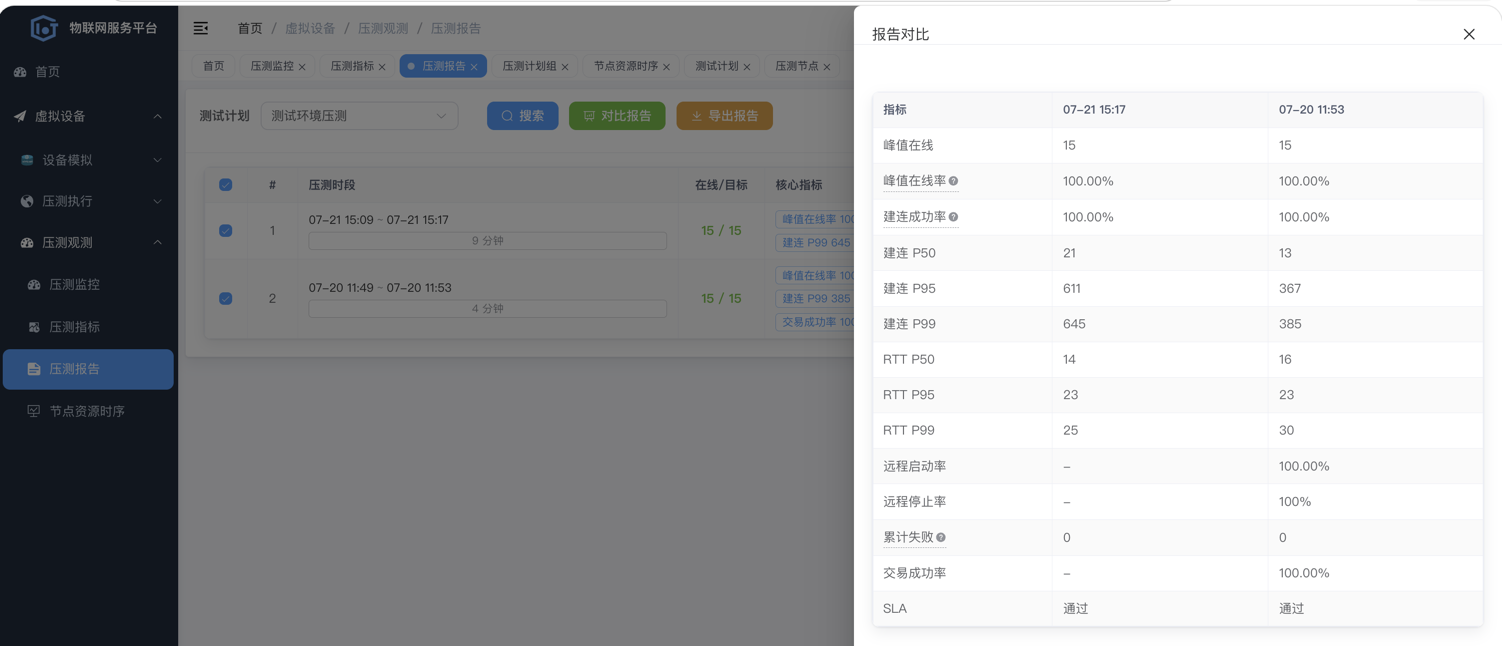
- Reports: Generated automatically when a plan stops; view, compare, and export under Load test reports
Agent deployment
Run as JAR
java -jar \
  -DsecurityKey=YOUR_NODE_ID \
  -DsecurityToken=YOUR_NODE_TOKEN \
  ruoyi-device-agent.jar
Run with Docker (optional)
Use the image version shown in the console Command dialog. Example:
docker run \
  -e JAVA_OPTS='-DsecurityKey=YOUR_NODE_ID -DsecurityToken=YOUR_NODE_TOKEN' \
  -v ./logs/agent:/ruoyi/device-agent/logs/ruoyi-device-agent \
  --name device-agent -d \
  registry.cn-guangzhou.aliyuncs.com/plus-prod/device-agent:2.6.2
Startup parameters
| Parameter | Meaning | Default |
|---|---|---|
securityKey | Stress-test node ID from the system | Required |
securityToken | Stress-test node token from the system | Required |
workingTime | Seconds after remote start until auto-stop (±15 s tolerance) | — |
ctl.host | Control plane host | api.qiulin2018.cn |
ctl.port | Control plane port | 80 |
ctl.path | WebSocket path | /ctl/ |
ctl.ssl | Use SSL | false |
Console features
| Menu | Capabilities |
|---|---|
| Stress nodes | Node CRUD, agent commands, launch/stop plans, stop orders, click name for status |
| Test plans | Plan CRUD, run status, links to monitor / timeseries / reports |
| Load monitor | Running plans overview, online/target, SLA tags, 30 s refresh |
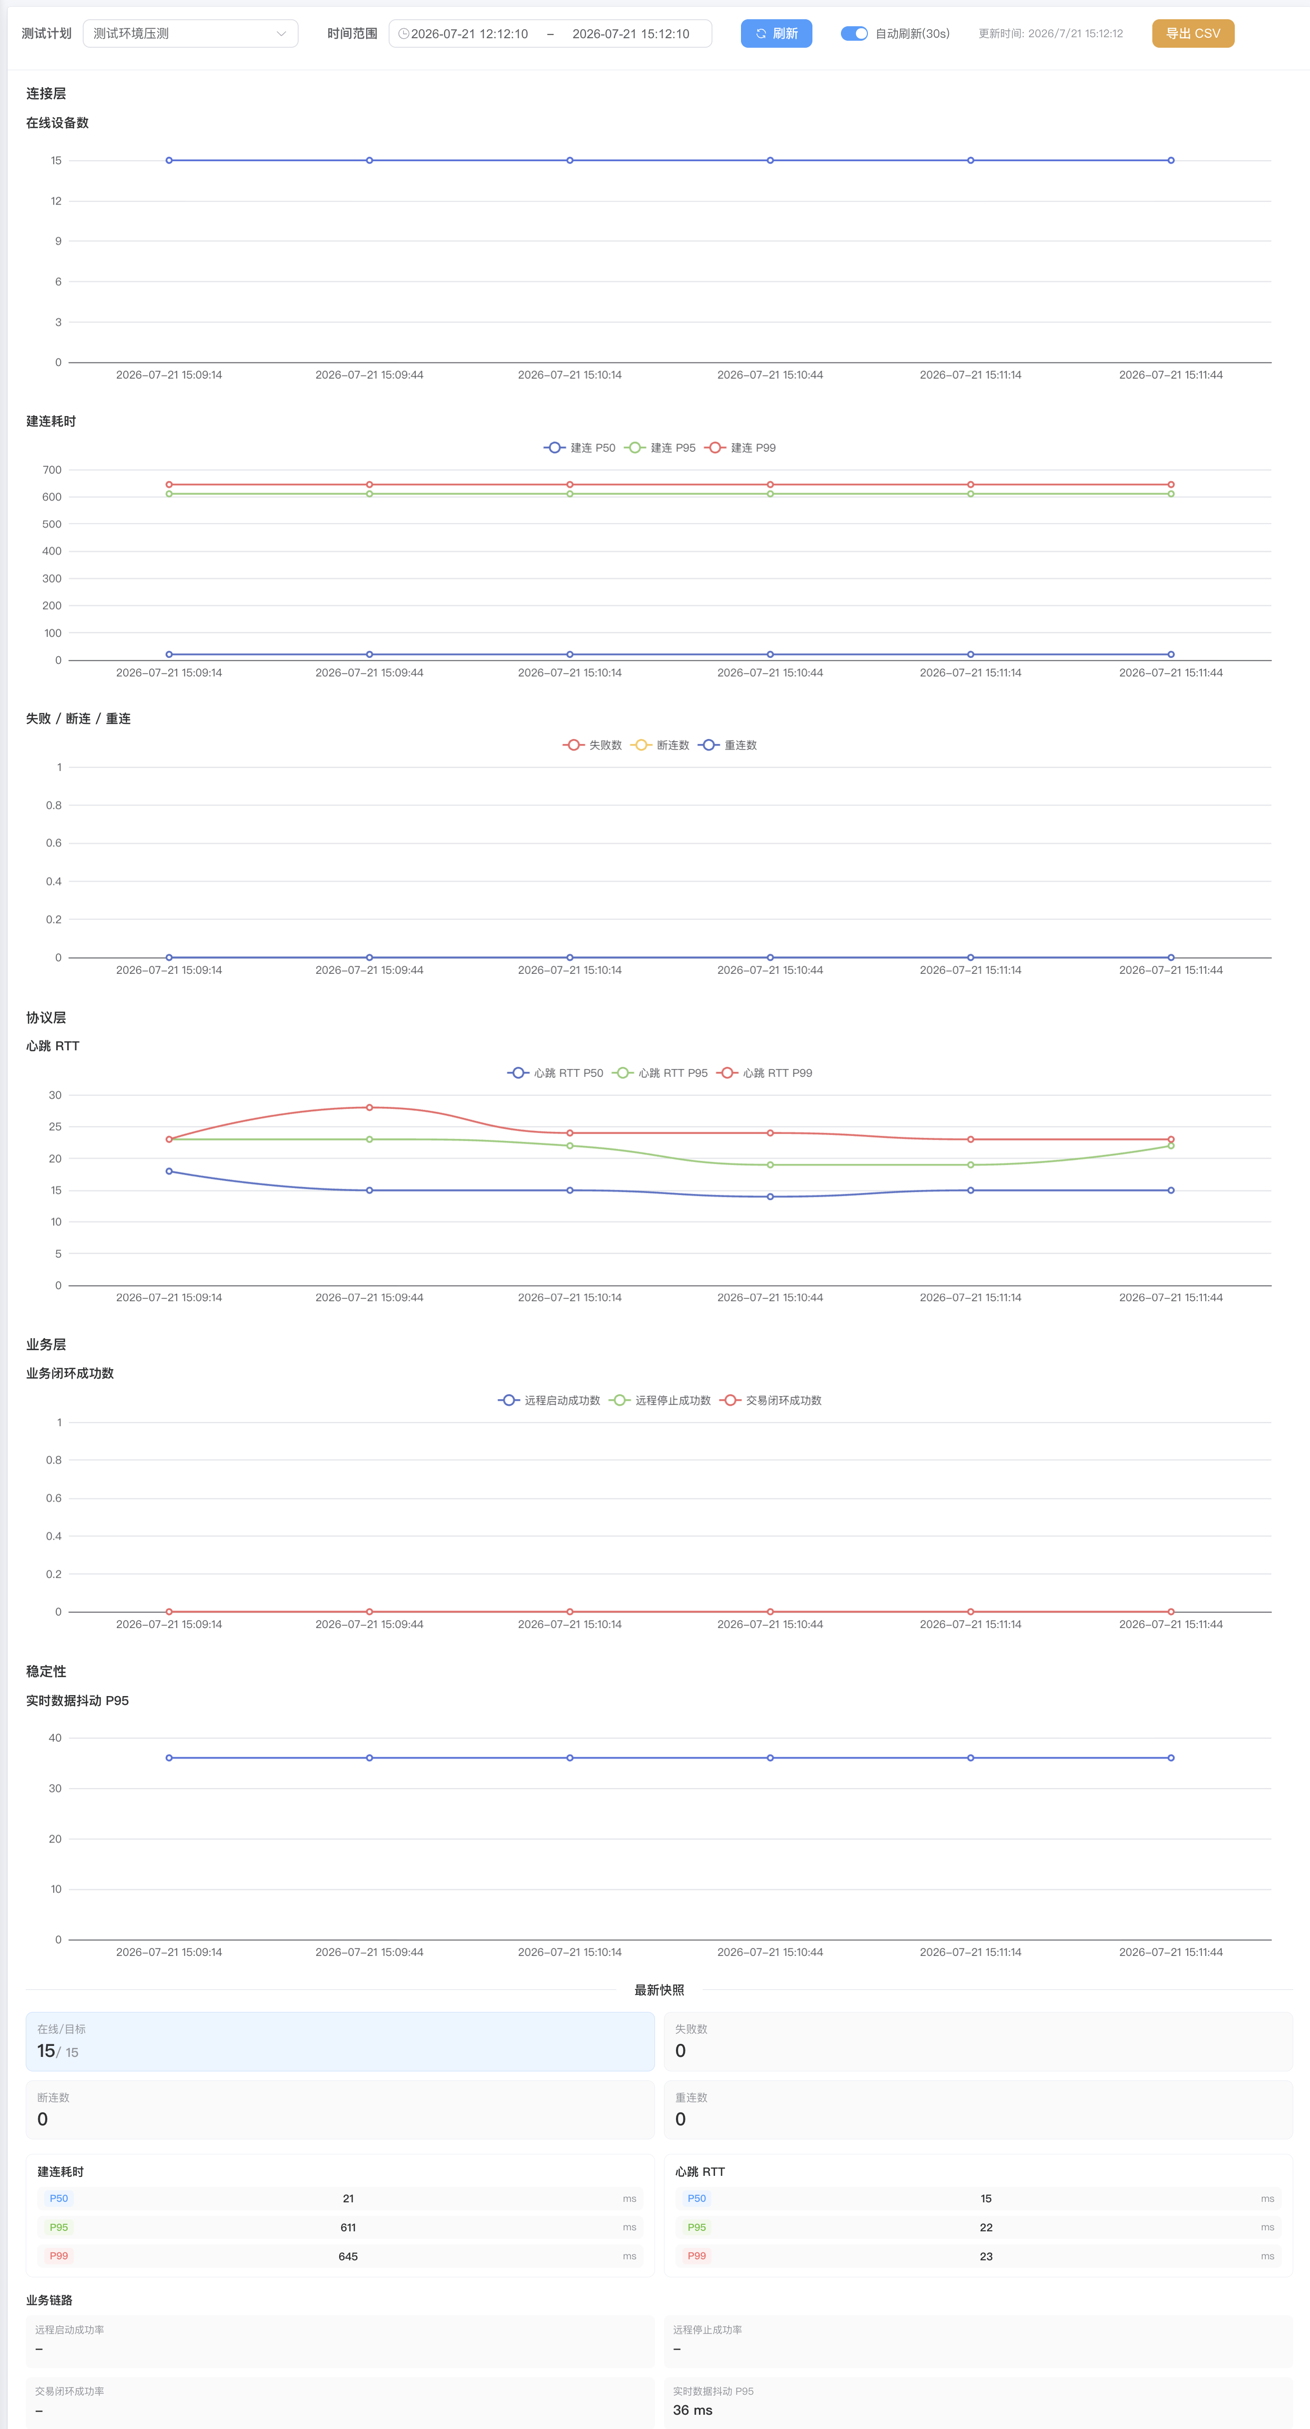
| Load metrics | Plan-level timeseries (connect, RTT, business success rates, etc.) |
| Load test reports | History, compare two reports, Excel export |
| Plan groups | Multi-plan / multi-node aggregation, online reconciliation, group SLA |
| Node resource timeseries | Agent CPU, memory, bandwidth, device count curves |
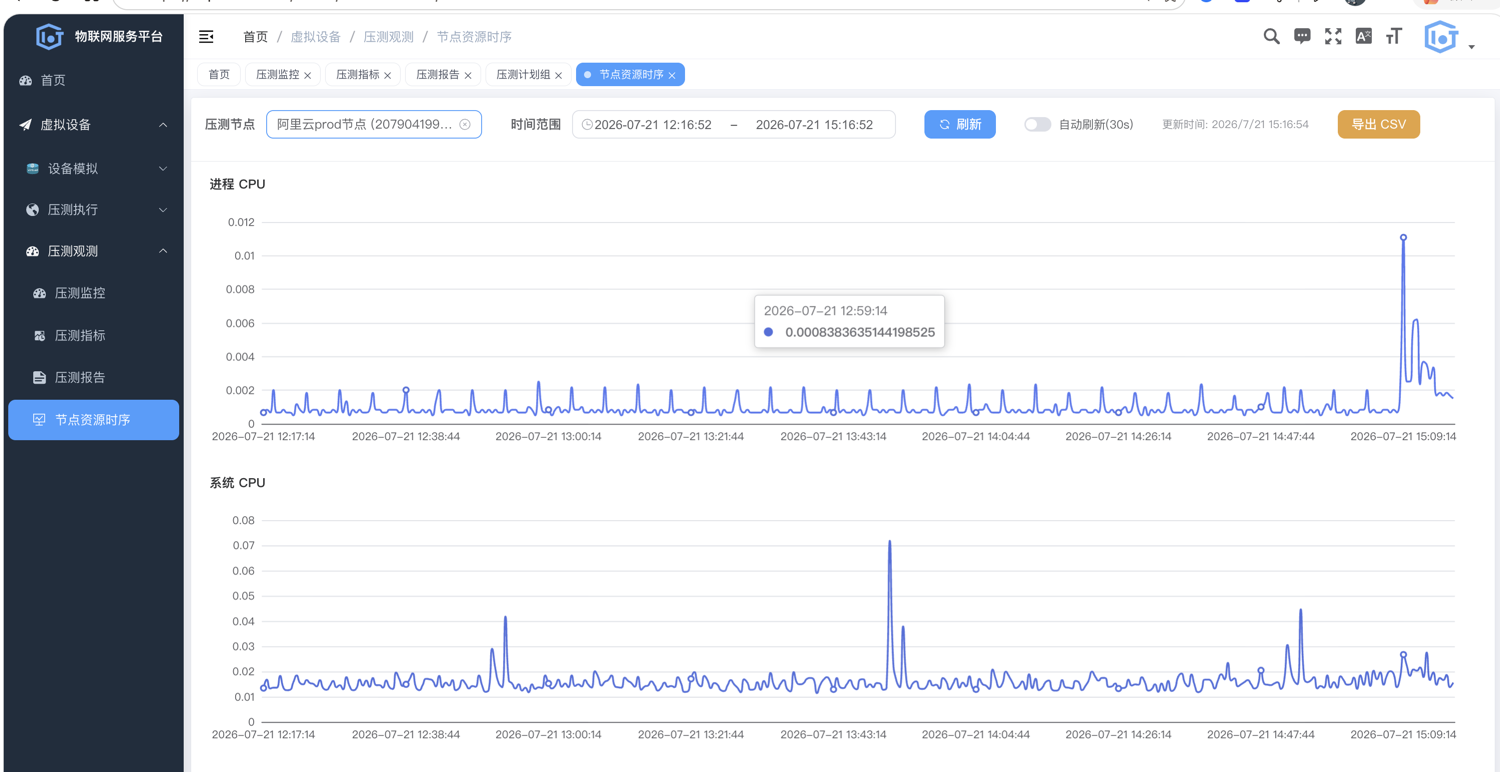
Metrics and SLA
Agents report node resources and plan business metrics every 30 seconds. The console groups metrics as:
| Layer | Examples |
|---|---|
| Connection | Online count, connect P50/P95/P99, failures, disconnect/reconnect |
| Protocol | Protocol heartbeat RTT P50/P95/P99 |
| Business | Remote start/stop success, transaction closure rate, monitor-data jitter P95 |
| Stability | Fail reason TopN, frame rate snapshot |
| Node resources | Process/system CPU, heap, in/out bandwidth |
SLA (reports and monitor): connect success ≥ 99%, heartbeat RTT P95 ≤ 3000 ms, transaction rate ≥ 99.5%. Plan groups can define custom SLA thresholds for reconciliation.
Quota and permissions
- Each account has a device quota; check the banner before launching
- Monitor, reports, plan groups, etc. require admin-assigned permissions
- New deployments need menu SQL applied and services restarted
Use cases and limitations
Good for:
- LAN capacity testing of YKC and OCPP charging platforms
- Multi-node distributed simulation of many piles
- Dev/test protocol validation and regression
Current limitations:
- Reports use a stop-time snapshot; peak values are indicative, not full-run aggregation
- Plan groups do not support one-click batch start/stop across nodes
- Treat as MVP / internal beta; formal SLA gates need your own validation
FAQ
Where must load agents run?
Agents must reach your target protocol server. Same LAN as the server is recommended for bandwidth and stability.
How many devices per node?
Depends on machine specs and protocol load. Hard limit is your account device quota (see the quota banner).
When is a load test report generated?
After you stop a plan from the console or agent, the control plane generates a report automatically under Load test reports.
How do I run multi-node load tests?
- Create multiple nodes and deploy agents on different machines
- Create one plan per node (avoid overlapping device IDs)
- Launch each plan on its node
- Use Plan groups to aggregate total online count and per-node contribution
Is OCPP load testing supported?
OCPP 1.6-J and YKC 1.6 both support load testing. Choose the matching virtual device profile when creating a test plan; OCPP plans require the correct WebSocket path.
What if the agent shows offline?
Verify securityKey / securityToken and ctl.* connectivity, and check agent logs. Start/stop commands cannot be sent while offline.